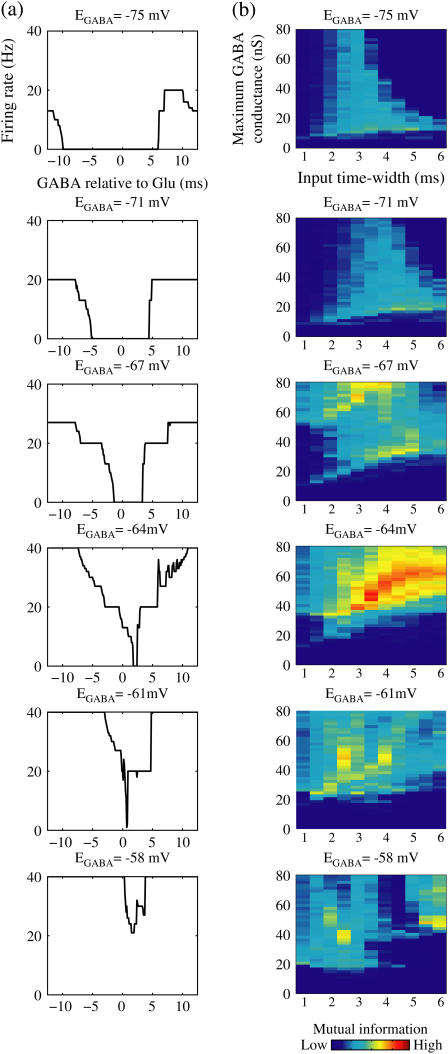
FIGURE 8.
Effects of change in the value of the GABAA reversal potential on the neuronal response to periodic glutamatergic and GABAergic inputs. (a) The relationships between the time difference Δt (ms) and the neuronal firing rate for the different values of the GABAA reversal potential indicated. The GABAA reversal potential is varied from  (mV) (top panel), which is equal to the resting potential of Wilson's model, to
  (mV) (bottom panel), which is equal to the firing threshold. The time-widths of the glutamatergic and GABAergic inputs are fixed to
  (ms). The maximum amplitude of the glutamatergic inputs is fixed so that the neuron shows a 1:2 phase-locked response, i.e., 20 Hz firing in the absence of GABAergic inputs, and the maximum amplitude of the GABAergic inputs is fixed to be
  (nS). (b) The dependence of the mutual information (see Methods for details) between the input phase difference and the output firing rate on the input time-width (the horizontal axis) and the maximum amplitude of the GABAergic inputs (the vertical axis) when the value of the GABAA reversal potential is systematically varied from
  (mV), the resting potential, to
  (mV), the firing threshold. The color represents the amount of mutual information as indicated by the color bar at the bottom.

