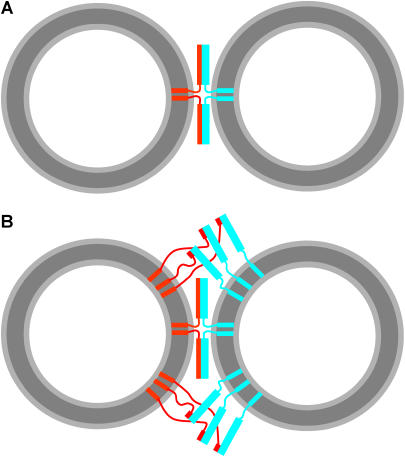
FIGURE 4.
How many SNARE complexes induce lipid mixing? (A) Model of two fully assembled SNARE complexes located between the most proximal regions of two vesicles. The model was drawn approximately to scale to represent the relative sizes of the SNARE complexes and 40 nm vesicles and to illustrate that SNARE complex assembly should bring the opposing membranes within 2–3 nm, but it is unclear whether this is sufficient for membrane merger. (B) Model analogous to A but including additional SNARE complexes that are initiating assembly at their N-termini with the rest of their SNARE motifs unstructured. The model is intended to illustrate the possibility that massive formation of SNARE complexes between more distal parts of the two membranes might actually induce lipid mixing rather than formation of a few SNARE complexes in the proximal intermembrane space. In panels A and B, synaptobrevin is colored in red and syntaxin/SNAP-25 heterodimers in cyan. Curves with arbitrary shapes indicate unstructured regions (i.e., the SNARE motif of free synaptobrevin and the linker sequences between the TM regions and the SNARE motifs of syntaxin and synaptobrevin). Thin rectangles represent individual helices (i.e., TM regions and the synaptobrevin SNARE motif upon partial or full assembly of SNARE complexes), and wide rectangles represent the helix bundle formed by the syntaxin and SNAP-25 SNARE motifs.

