FIGURE 1.
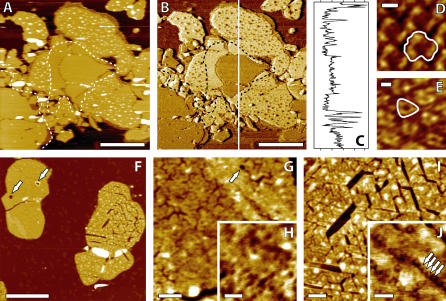
Distinction of PM EC and CP sides using AC-AFM (A–E). Topographic image (A). The phase image (B) reveals a contrast between EC patches (darker) and CP patches (lighter). A profile of (B) gives ∼7°CP-EC shift and ∼15°CP-mica shift (C). High resolution topographic images of PM CP (D) and EC (E) side obtained by zooming respectively on the lighter and darker patches in (B). The protrusions on the CP patches and a “smooth belt” around the EC patch are clearly visible in panels A and B (dashed line). Effect of salt removal on the PM imaged by AC-AFM in air (F–J). The membrane has been rinsed with ultrapure water and dried at room temperature. The EC (pitted) and CP (cracked) sides of PM after drying (F). Higher magnifications of the EC patch (G and H). Hexagonal depressions related to the CP leaflet and pits are visible. Higher magnification of the CP cracked patch (I and J). Arrows point to larger holes crossing EC patches in panels F and G and to trimers in panel J. The scale bar is 1 μm (A and B), 10° (C), 3 nm (D and E), 1 μm (F), 100 nm (G), 50 nm (H), 100 nm (I), and 50 nm (J). Panels F–I are topographic images, and J is a phase image.

