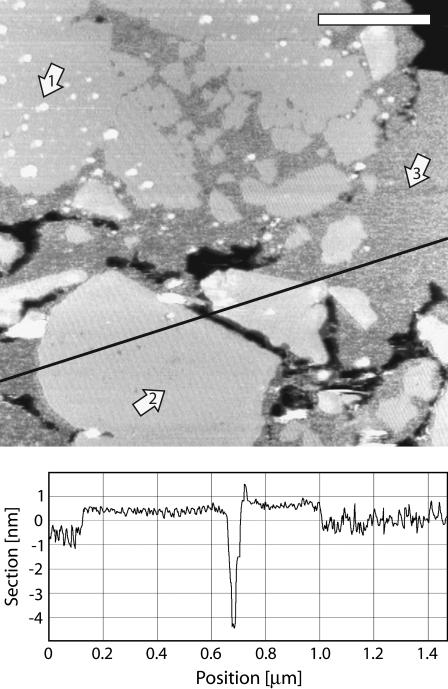
FIGURE 2.
PM assembly at pH 10. The arrows 1, 2, and 3 show CP patches, EC patches, and nonassembled membrane, respectively. The nonassembled membrane is ∼1 nm thinner than ordered lattice (profile line). Different lattice orientations are observable in assembled patches, and protrusions are visible in and around CP patches. The scale bar is 400 nm.

