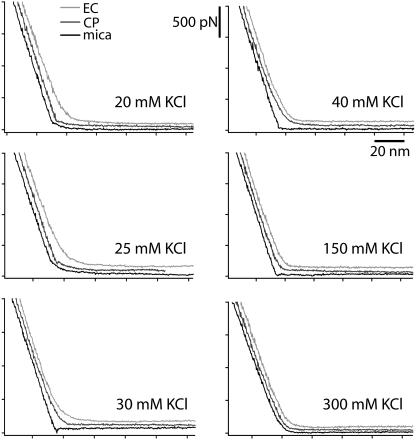
FIGURE 3.
Force curves on the EC side (light shaded) and the CP side (dark shaded) of PM and on mica (solid) at different salt concentrations (20–300 mM KCl). The curves have been offset for better visibility. The maximum force applied by the tip is ∼2 nN (500 pN force scale) corresponding to the force beyond which all the curves look similar when superimposed, regardless of the sample.

