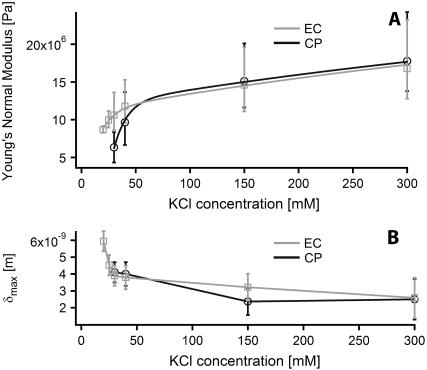
FIGURE 6.
Young's normal bulk modulus of PM evolution with KCl concentration at pH 8, measured from each side independently by fitting force curves with Chadwick's model (A). The evolution of the values obtained is fitted with a biexponential curve. Evolution of the maximum tip indentation δmax in the membrane, also obtained from force curves fitting (B).

