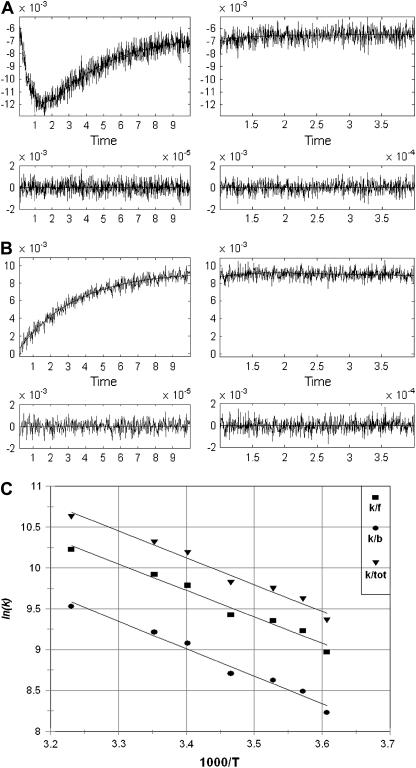
FIGURE 1.
Time-resolved absorption changes. In the left-hand panel the initial reaction phase is shown. The reaction is followed further at a slower timescale in the right panel. (A) CuA reduction and reoxidation monitored at 825 nm. Enzyme concentration, 52 μM; MNA concentration, 5 mM; argon saturated buffer, 10 mM phosphate, 0.5 mM DM, pH 7.5. Temperature, 298 K. Optical pathlength, 3 cm. Pulse width, 1.0 μs. (B) Heme a reduction monitored at 605 nm. Enzyme concentration, 15.4 μM; MNA concentration, 5 mM; argon saturated buffer, 10 mM phosphate, 0.5 mM DM, pH 7.5. Temperature, 298 K. Optical pathlength, 3 cm. Pulse width, 0.3 μs. (C) Temperature dependence of rate constants for the forward (kf), reverse (kb), and total (ktot) reaction as depicted in Eq. 1.

