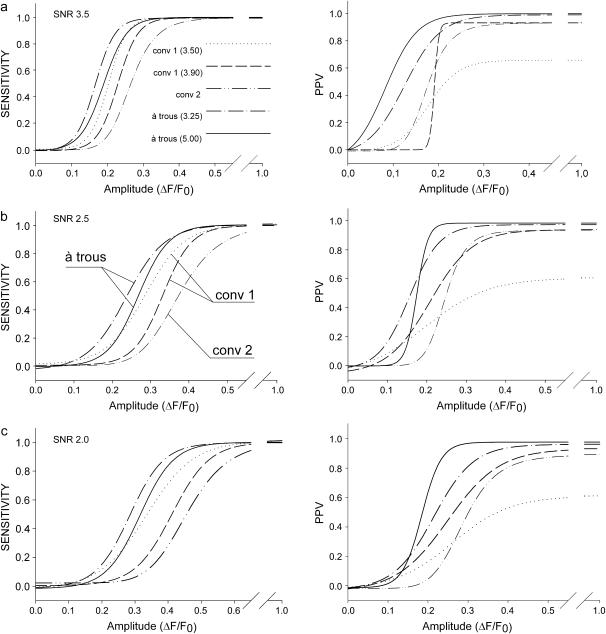
FIGURE 4.
Sensitivities (left column) and positive predictive values (PPV, right column) at (a) SNR 3.5, (b) 2.5, and (c) 2.0 for the wavelet algorithm (δ = 4.00, τ = 3.25, dashed-dotted lines; δ = 4.00, τ = 5.00, solid lines) and the conventional algorithms (κ = 3.9, dashed lines; κ = 3.5, dotted lines) are shown. The algorithm as in Cheng et al. (15) is labeled conv1 and the algorithm by Izu et al. (11) conv2. Curves shifted to the left denote improved detection properties.

