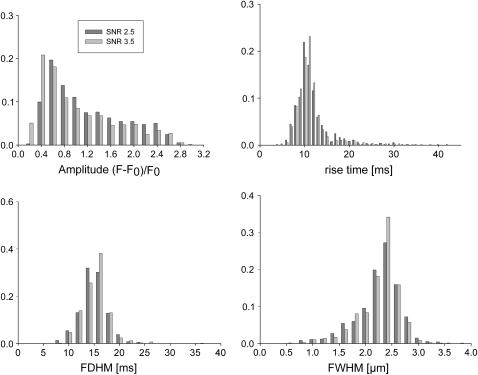
FIGURE 6.
Event parameter histograms resulting from the analysis of synthetic images in the line-scan sampling mode. The analysis of the median filtered raw data yields comparable results for both noise levels SNR 3.5 (light gray) and 2.5 (dark gray). RT (8.2 ms), FDHM (16.4 ms), and FWHM (2.39 μm) can reliably be estimated from the distribution modes. All ordinates show relative frequencies.

