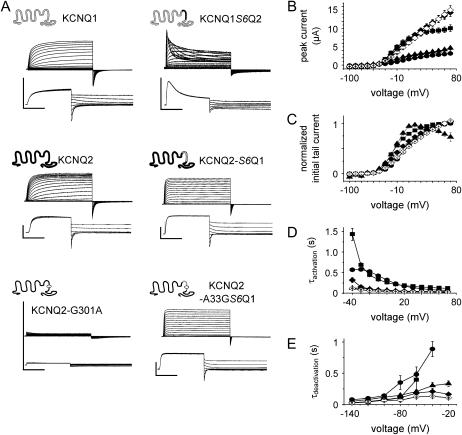
FIGURE 3.
KCNQ1-KCNQ2 chimera activate rapidly, inactivate to a different degree, and gate faster with a Gly at the gating hinge position. (A) Shown are current traces from KCNQ1, KCNQ2, KCNQ2 point mutant KCNQ2-G-301A, and KCNQ1/KCNQ2-chimera. The chimera KCNQ1S6Q2 was constructed by splicing the S6 segment from KCNQ2 (black region) into the homologous position in KCNQ1. The chimera KCNQ2S6Q1 was constructed by splicing the S6 segment from KCNQ1 into the homologous position in KCNQ2 resulting in an inverse chimera. Further, in this chimera the Ala at the putative hinge position was mutated to Gly as indicated by the circle in the lower cartoon. Representative current traces of the constructs measured with the same pulse protocols as in Fig. 2 are shown below the cartoon. The horizontal scale bars indicate 1 s, the vertical 5 μA. (B) Peak current amplitudes of KCNQ1 (circles), KCNQ2 (squares), KCNQ1S6Q2 (triangles), Q2-S6Q1 (solid diamonds), and Q2-A-336GS6Q1 (open diamonds) channels were measured and plotted versus voltage. (C) Initial tail current amplitudes were determined and normalized to the maximal initial tail current amplitude. The data were fit to the Boltzmann equation and values were KCNQ2: V1/2 = −23.0 ± 1.0, k = 14.2 ± 0.9, n = 10; Q1S6Q2: V1/2 = −24.8 ± 3.1, k = 10.8 ± 2.7, n = 10; Q2S6Q1: V1/2 = −11.8 ± 1.7, k = 22.3 ± 1.7, n = 7, and Q2S6Q1-A-336G: V1/2 = 0.8 ± 1.7, k = 25.4 ± 1.8, n = 7. Symbols are used as in panel B. (D) The rising/activating phase of KCNQ1, KCNQ2, Q2S6Q1, and Q2A-336GS6Q1 current traces at depolarizing pulses were fit to a single exponential function, and the time constants of channel activation (τactivation) are shown. The rising and decaying phases of KCNQ1S6Q2 current traces at depolarizing pulses were fit to a double exponential. The values of the fast increasing phase describe channel activation. The time constants of activation (τactivation) are plotted versus test pulse voltages. Symbols used as in panel B. (E) The deflection of tail current traces upon channels' closure were fit to a single exponential function, and the time constants (τdeactivation) of channel deactivation are shown. Usage of symbols is as in panel B. Mean data are shown with error bars as mean ± SE.

