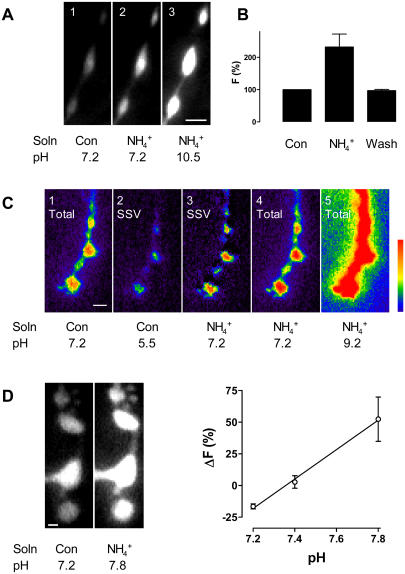
FIGURE 1 .
(A) ANF-Tpz responses in type III boutons. (1) Peptide fluorescence under control conditions in Ca2+-free saline; (2) approximate doubling of fluorescence after collapsing the vesicular pH gradient at pH 7.2; (3) increase in signal after setting the vesicular pH to 10.5. Bar is 2 μm. (B) The ammonium effect is reversible at pH 7.2 (n = 4). (C) Synaptophluorin responses in type I boutons. (1) Pseudo-color representation of synaptophluorin fluorescence under control conditions, which includes the vesicular and surface signals; (2) vesicular signal revealed after quenching surface fluorescence with pH 5.5 medium; (3) vesicular signal at pH 7.2. Obtained by subtracting surface signal (1 − 2) from total signal after setting the pH to 7.2 in all compartments with ammonium (4). (5) Total synapto-phluorin signal after setting the pH to 9.2, which was used with 4 to calculate the pK of the indicator. Bar is 2 μm. (D) Cytoplasmic YFP responses in type I boutons. (Left) Fluorescence increase after setting the pH to 7.8. Bar is 1 μm. (Right) Change in YFP fluorescence versus cytoplasmic pH; n = 4 for pH 7.2, 4 for pH 7.4, and 3 for pH 7.8.

