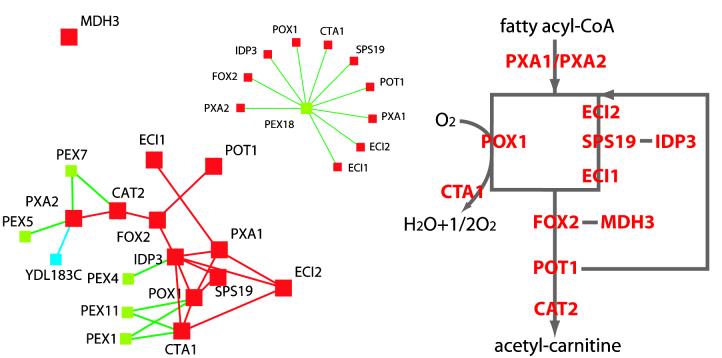
FIG. 4.
Nearest-neighbor relationships of beta-oxidation genes superimposed on a two-dimensional visualization of expression profile similarities (compare with Fig. 3). The lines between genes A and B indicate that the expression profile of gene A is among the 10 nearest neighbors, i.e., the most highly correlating profiles, of gene B in the complete data set of Gasch et al. (13). For clarity the nearest-neighbor relationship between almost all beta-oxidation genes and PEX18 is shown in an inset. The topology of the beta-oxidation pathway is shown for reference. Red, beta-oxidation genes; blue, lysine biosynthesis genes; green, peroxisome biogenesis genes.

