
Figure.
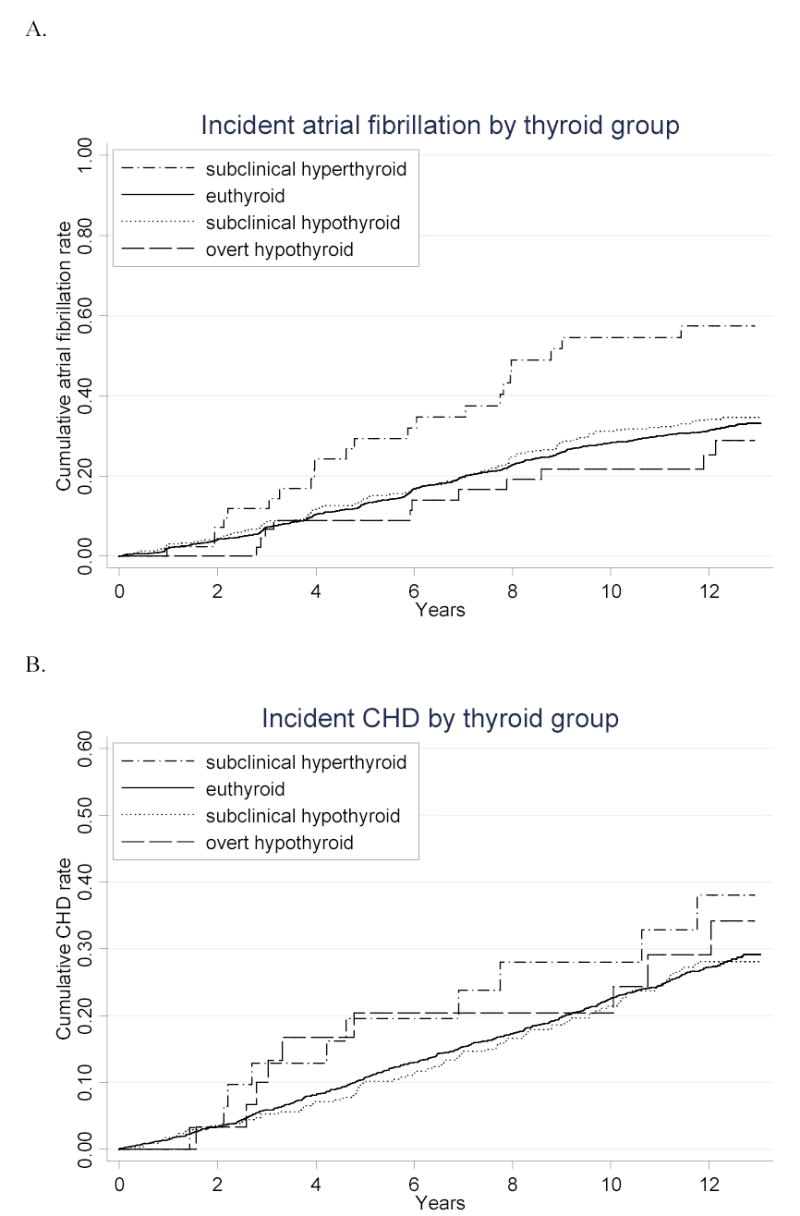
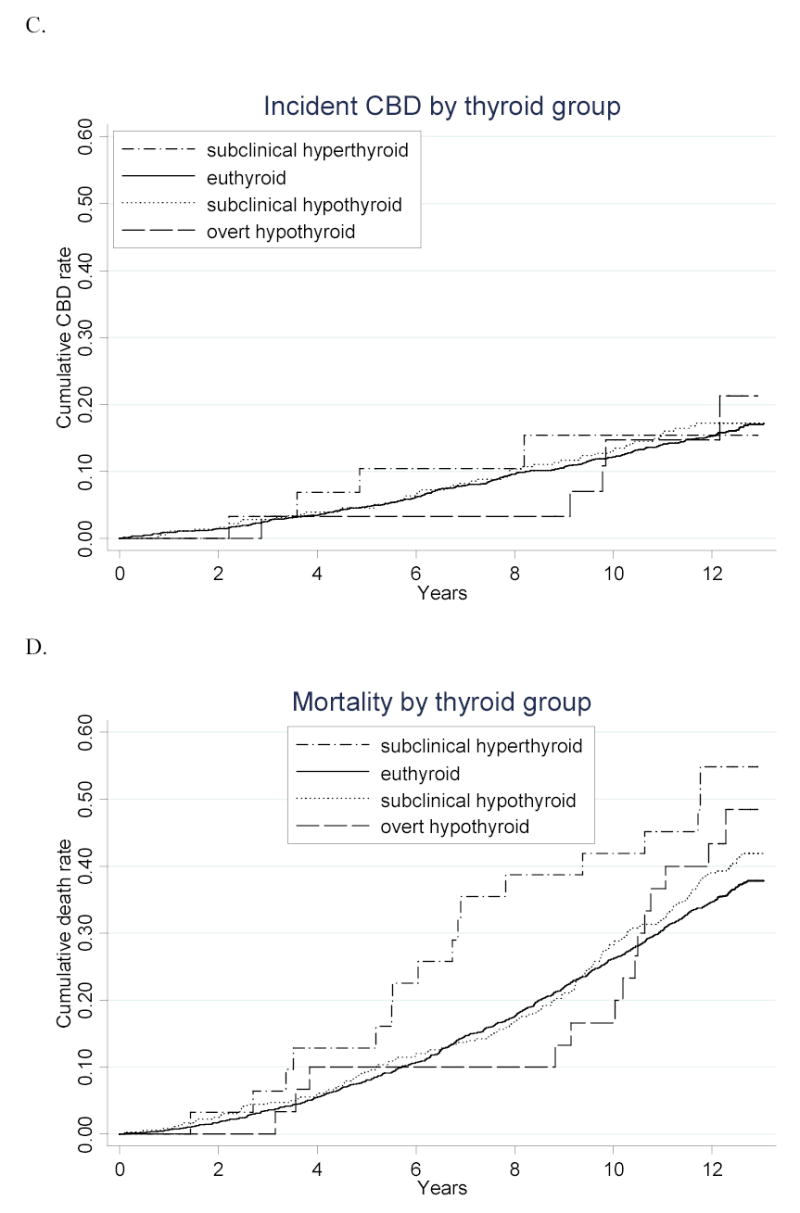
Cumulative incidence of A. atrial fibrillation, B. coronary heart disease, C. cerebrovascular disease, and D. death from all causes over the 13 years of follow-up, according to thyroid status. Number at risk for atrial fibrillation plot: n=47 for subclinical hyperthyroid, 2502 for euthyroid, 472 for subclinical hypothyroid, and 49 for hypothyroid. Number at risk for coronary heart disease, cerebrovascular disease, and mortality plots: n=31 for subclinical hyperthyroid, 1838 for euthyroid, 347 for subclinical hypothyroid, and 30 for hypothyroid. P<.001 for comparison of atrial fibrillation incidence between subclinical hyperthyroid and euthyroid groups. P=.02 for comparison of mortality between subclinical hyperthyroid and euthyroid groups. All other comparisons are not statistically significant.