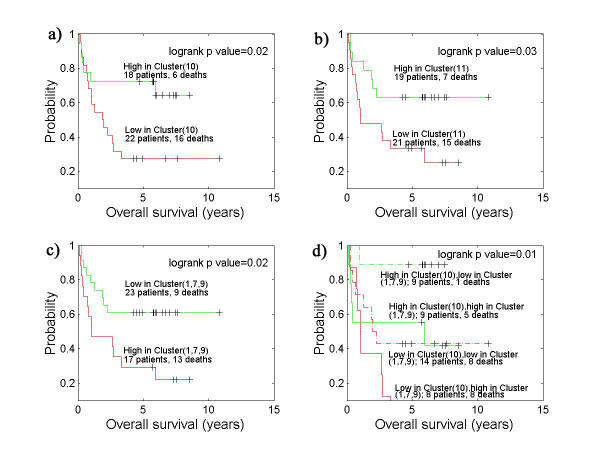
Figure 2.
Clinically distinct DLBCL subgroups defined by gene expression profiling. a) Kaplan-Meier plot of overall survival of DLBCL patients grouped on the basis of gene expression profiling in K-means cluster 10. b) Kaplan-Meier plot of overall survival of DLBCL patients grouped on the basis of gene expression profiling in K-means cluster 11. c) Kaplan-Meier plot of overall survival of DLBCL patients grouped on the basis of gene expression profiling in K-means cluster (1,7,9). d) Kaplan-Meier plot of overall survival of DLBCL patients grouped on the basis of gene expression profiling in K-means cluster 10 and cluster (1,7,9).

