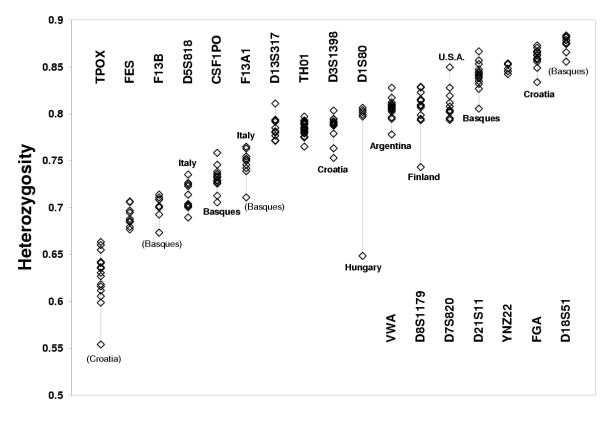
Figure 3.
Heterozygosities of 17 loci in samples from 27 Caucasian populations For each locus, the populations that resulted outliers at the Tukey multiple comparison test are indicated (bold); populations in brackets were non-significant at the test, though they point to samples with heterozygosity consistently lower than average (Basques and Croatians).

