
Fig. 5.
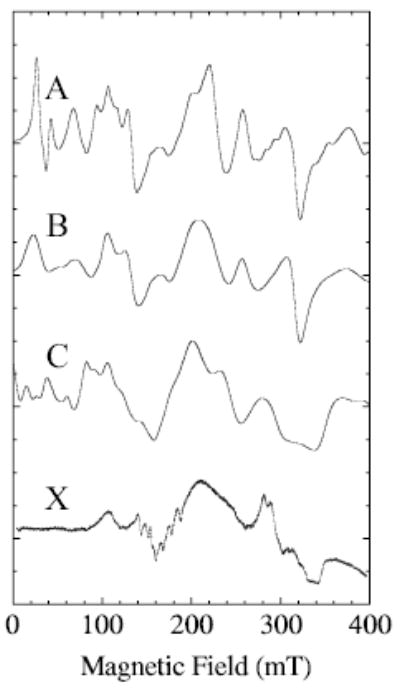
Effects of a distribution in D, or manganese nuclear hyperfine splitting, on calculated spectra are shown for simulations with D and E = 0.1 and 0.013 cm−1 respectively. All calculations have Se = 5/2. Spectrum A was calculated with no distribution in D; spectrum B was calculated with a distribution in D but E held constant; spectrum C was calculated (XSophe) with no distributions but manganese nuclear hyperfine splitting (91 mT, 0.0086 cm−1) was included; spectrum X is the experimental X-band spectrum of MnLO. Other simulation parameters are those given in the Fig. 4 legend, except that the calculation was only over the range 0 to 500 mT and the line shape was Gaussian (300 MHz width). For the distribution, nine spectra were calculated varying D by 0.005 between 0.08 and 0.12 cm−1. The distribution of amplitudes by which the subspectra were multiplied was based on values of D and was Gaussian of full width at half height equal to 0.012 cm−1.