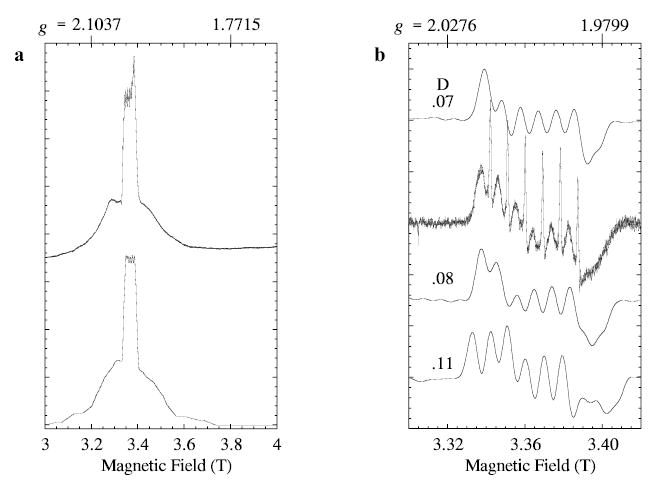
Fig. 7.

Simulations (XSophe) of W-band EPR spectra of manganous lipoxygenase. a The high-power experimental spectrum (the same as in Fig. 1b) is compared with the calculated absorption spectrum (lower) with D and E = 0.08 and 0.015 cm−1, respectively. b The central region of the low-power experimental spectrum (the same as in Fig. 2) is compared with three simulations for several values of D, as indicated on the figure. In both the a and the b calculations, the microwave frequency is 94.22 GHz, the line width is 84 MHz, the manganese nuclear hyperfine is 0.0086 cm−1 (isotropic) and the g-factor was taken as 2.0 (isotropic). The values of E and (D) for the calculations in b are 0.016 (0.07). 0.015 (0.08), and 0.013 (0.10) cm−1, respectively.
