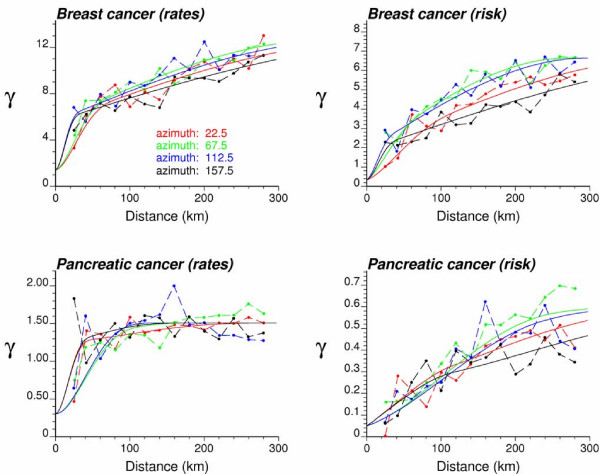
Figure 5.
Directional semivariograms for breast and pancreatic cancer mortality rates and risks with the model fitted. The semivariograms of raw mortality rates (left column) and the semivariograms of the risk (Equation 4, right column) are computed in four directions; azimuth angles are measured in degrees clockwise from the NS axis. The solid curve denotes the anisotropic (i.e. direction-dependent) model fitted using weighted least-square regression (program poisson_kriging.exe in [8]).

