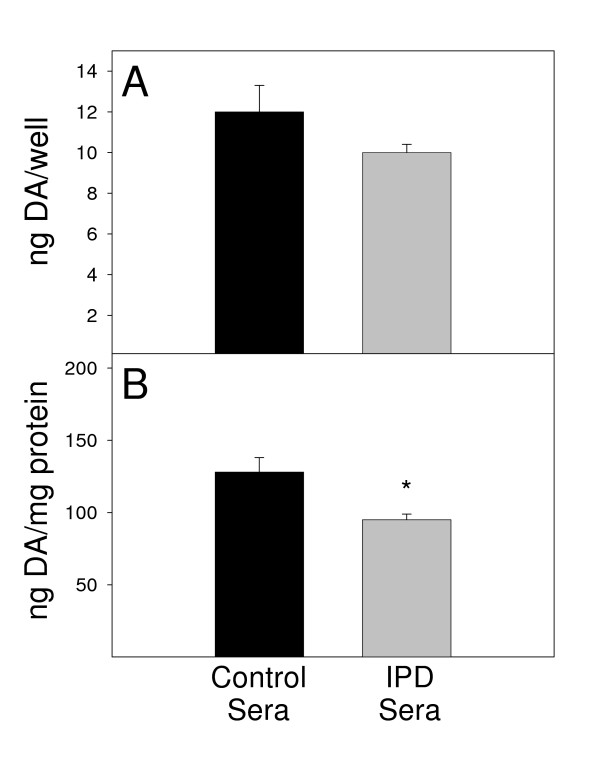
Figure 4.
After 72 hr exposure to human sera at 37°C, DA levels were assessed in co-cultures of MN9D neuronal cells (4 × 10⁴ cells/ml) and N9 microglia (2 × 10⁴ cells/ml). Black bars represent DA values upon exposure to 8 control sera and gray bars represent values upon exposure to 19 sera from IPD patients. Results are reported as both (A) ng/well and (B) ng/mg protein. Bars represent the mean and standard error of the mean for four individual experiments. *P < 0.05 compared to control sera.

