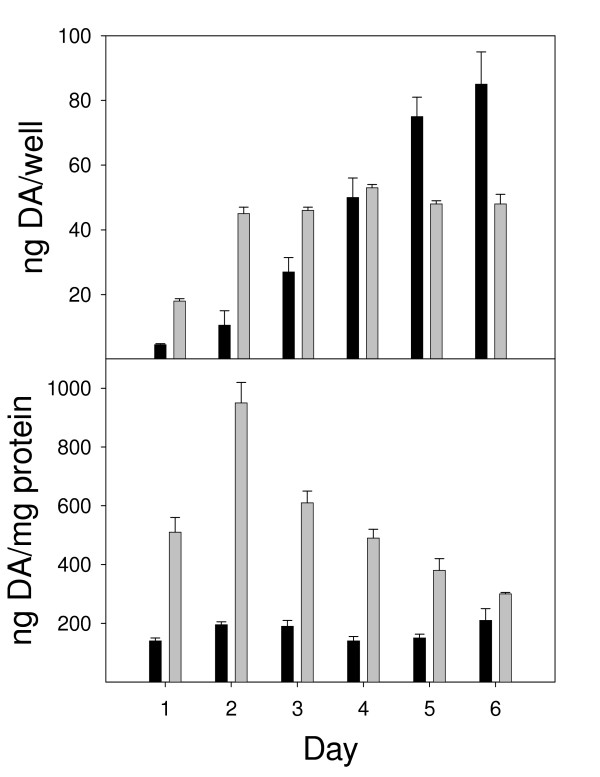
Figure 5.
Time course of DA expression by MN9D neuronal cells after exposure to n-butyrate. Black bars represent untreated cells and gray bars represent cells differentiated in the presence of 1 mM n-butyrate. Results are reported as both (A) ng/well and (B) ng/mg protein. Results represent the data from three individual wells per group. *P < 0.05 compared to untreated cells.

