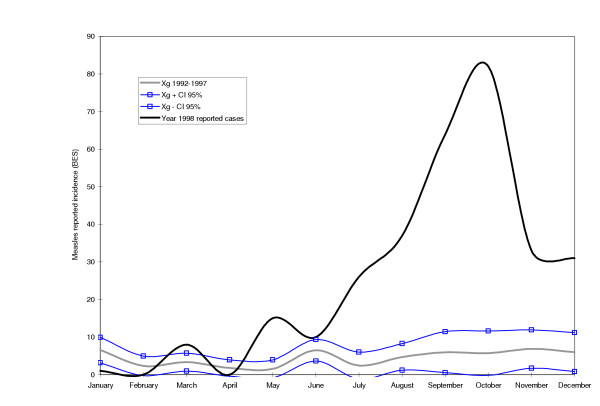
Figure 2.
Cases of measles during an outbreak in the year of 1998 in Maputo City. The continuous bold line represents the reported cases of measles in 1998. The grey line represents the geometric mean of reported measles cases for the years 1992–1997. The lines with squares represent the upper and lower endemic ranges.

