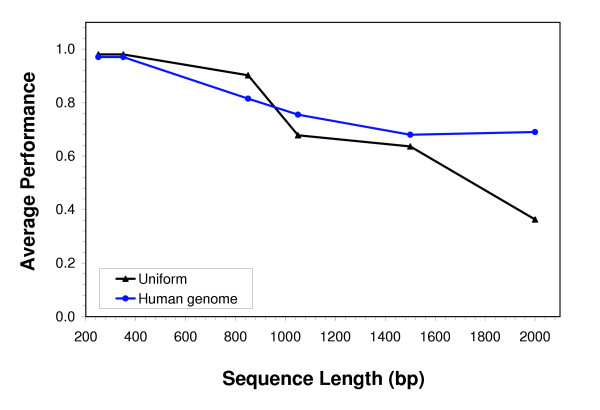
Figure 4.
Bipad performance for various input sequence lengths. The graph shows the performance of Bipad (Y-axis) for recognition of S-MAR binding sites embedded in background sequences of varying lengths. Each S-MAR site was embedded in a background either with a uniform composition [black line], or having the average human genomic composition [blue line]. The background sequence was varied from 250 to 2000 bp in length (X-axis). The performance calculation is given in Reference [2]; each data point has been averaged over three replicates.

