
Figure 3.
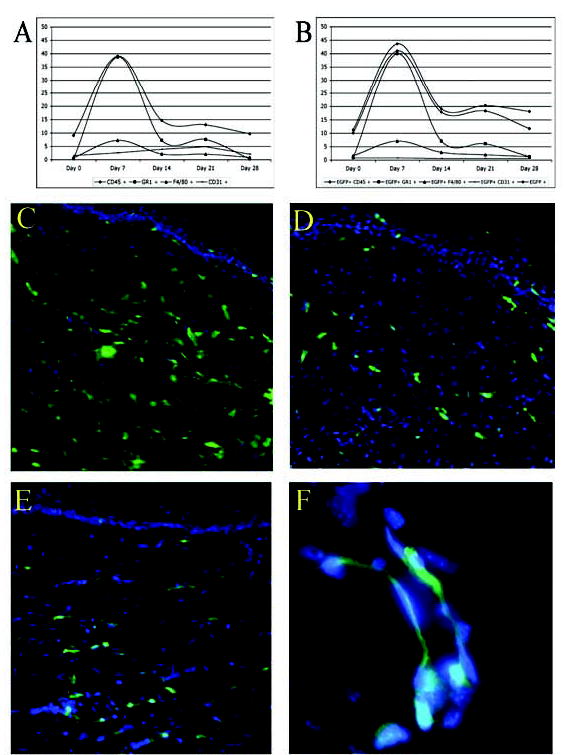
(A): Cumulative graph of flow cytometry data obtained from the control mice, including normal skin (day 0), and during wound healing. The y-axis represents the percentage of cells in the wound that stains with the respective antibodies. (B): Cumulative graph of flow cytometry data obtained from the EGFP-expressing chimeras. The percentages of each cell population in the control and experimental groups are very similar; however, bone marrow–derived cells remain in the healed wound and account for more than 15% of all cells in the healed wound (day 28). On fluorescent microscopy, EGFP+ cells were seen throughout the healing dermis during the early inflammatory phase on days 14 (C) and 21 (D) after wounding. (E): EGFP+ cells persisted in the dermis during the remodeling phase, as seen here on day 42 after wounding. Note the histological resemblance of the EGFP-positive cells to fibroblasts. (F): Microvessel deep in the wound shows EGFP-expressing cells either within the lumen (endothelial cells) or adjacent to the luminal cells (pericytes). Abbreviation: EGFP, enhanced green fluorescent protein.