Figure 5.
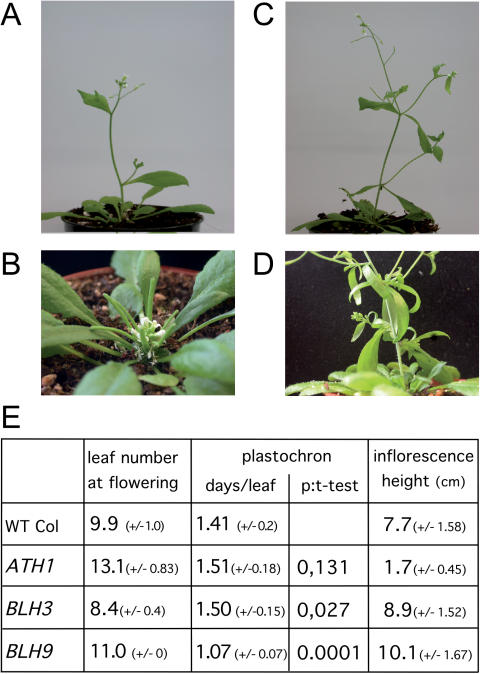
Phenotypes of STM partner protein overexpression. (A) Wild-type inflorescence shoot for comparison to BLH gene overexpression lines at the same stage. (B) Stunted inflorescence of an ATH1 overexpressing plant, note maturing siliques at the base close to flowers at the tip. (C) BLH9 overexpression line with multiple cauline leaves emerging from single nodes. (D) Close-up of another BLH9 overexpression inflorescence. (E) Number of leaves at flowering, plastochron and inflorescence length in T3 progeny of ATH1, BLH3 or BLH9, overexpressing lines used for crosses into the STM-GR background (WT Col: Columbia control plants). T-test P-values in the plastochron column are relative to wild type and substantiate the significance of the shorter plastochron in BLH9 overexpressing plants. All numbers are based on two independent lines (BLH9: 3 lines) and 6–10 progeny each.

