
Fig. 1.
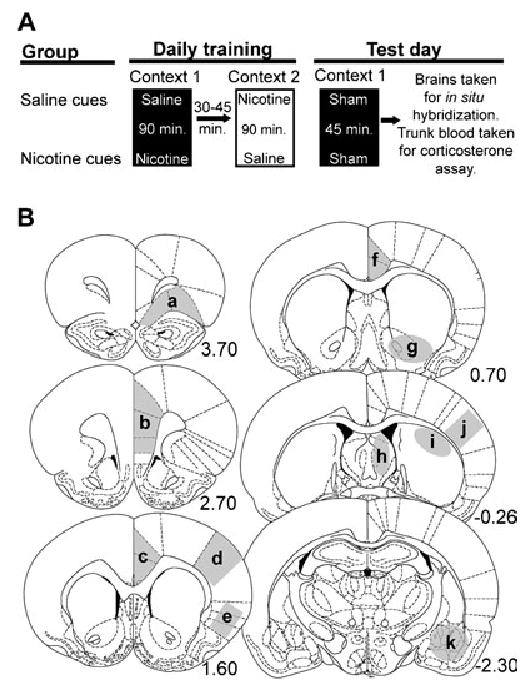
Schematic diagrams of the experimental procedure and brain areas analysed. (A) Rats were trained to receive an ascending dose regimen of nicotine in one of two distinct, non-home cage environments. Rats were placed in context 1 after an injection of nicotine or saline while motor activity was measured. After 90 min in context 1, rats were returned to their home cages for 30–45 min. Rats were then taken to context 2 where they received the counterbalanced injection (rats that received an injection of saline in context 1 received an injection of nicotine and vice versa). After 90 min in context 2, rats were returned to their home cages where they remained until the next training day. The conditioning (training) phase of the experiment lasted 14 days. Three days after the last day of training rats were exposed to context 1 without any injections where they remained for 45 min while motor activity was measured. (B) Brain regions analysed for expression of arc mRNA: (a) lateral prefrontal cortex, (b) medial prefrontal cortex, (c) anterior cingulate cortex, (d) primary sensory cortex, (e) agranular insular cortex, (f) posterior cingulate cortex, (g) ventral striatum, (h) septum, (i) posterior dorsal striatum, (j) sensorimotor cortex, (k) amygdala. Numbers represent distance, in millimeters, from bregma (Paxinos & Watson, 1998).