
Fig. 3.
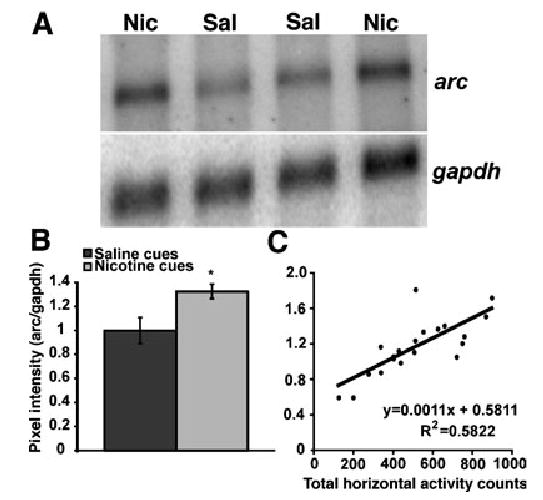
Northern blot analysis of arc mRNA in lateral prefrontal cortex. (A) Representative Northern blot of RNA from the lateral prefrontal cortex of two rats exposed to nicotine cues and two rats exposed to saline cues probed for arc mRNA (upper panel) and normalized to GAPDH mRNA levels (lower panel). Sal = saline cues, Nic = nicotine cues, gapdh = glyceraldehyde-3-phosphate dehydrogenase mRNA. (B) Average pixel intensity of arc signal normalized to gapdh (± SEM) for the saline cues (n = 10) and the nicotine cues (n = 10) groups. mRNA from one rat in the saline cues and in the nicotine cues group each was not included for quantification and statistical analysis due to obvious degradation of the samples (data not shown). A one-way anova indicated an increased level of arc mRNA in the lateral prefrontal cortex of the nicotine cues group compared with the saline cues group (*P < 0.05, see text for statistical details). (C) Total horizontal activity vs. normalized arc mRNA levels in lateral prefrontal cortex. Arc levels in lateral prefrontal cortex are positively correlated with total horizontal activity (R2 = 0.5822, t = 5.009, d.f. = 18, P < 0.0001).