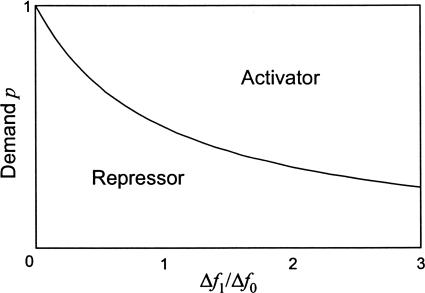
Fig. 2.
Selection diagram for error-load minimization. Each region corresponds to the mode of control with the smaller error-load. The vertical axis is the demand p, defined as the fraction of the time that the gene product is needed at full expression. The horizontal axis is the ratio Δf1/Δf0 of the fitness reductions arising from errors in the free sites of the negative and positive control mechanisms.

