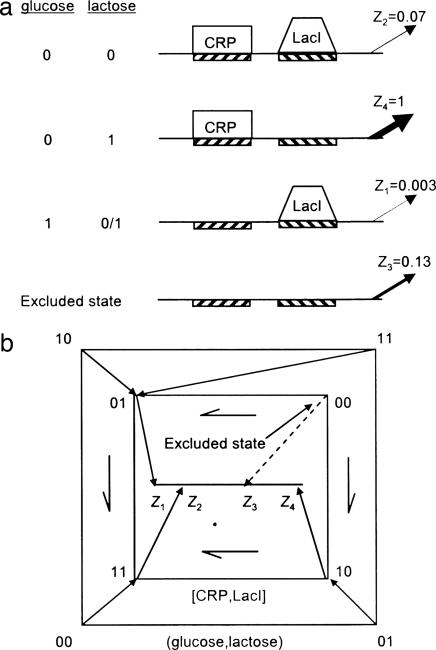
Fig. 4.
The lac system of E. coli and its regulatory mechanism. (a) Input–output relationship of the lac system and its molecular implementation. Glucose and lactose levels are 1/0 corresponding to saturating/no sugar in the environment. Z1, Z2, Z3, and Z4 are the relative protein expression levels from the lac promoter (30). The binding states of CRP and LacI are shown. (b) Diagram mapping the input states (glucose,lactose) onto the binding states [CRP,LacI] and finally onto the output states Z1, Z2, Z3, and Z4. The dashed arrow indicates the excluded state, which is not reached by any of the input states because of inducer exclusion. The arrows with asymmetric heads indicate errors by pointing away from free binding states.

