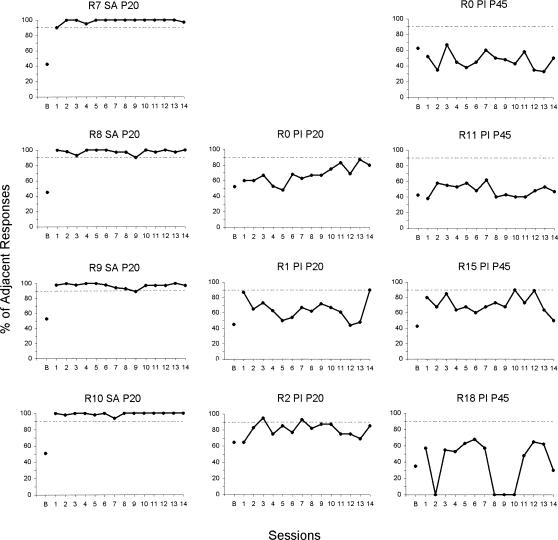
Figure 1. Percentage of adjacent (correct) responses per session by 4 normal rats that had a saline injection on P20 (left column), 3 rats that had a pilocarpine-induced seizure on P20 (middle column), and 4 rats that had a pilocarpine-induced seizure on P45 (right column).
The point marked B gives the percentage of reinforced responses during the last session (VI 45 s) before the start of auditory discrimination training.

