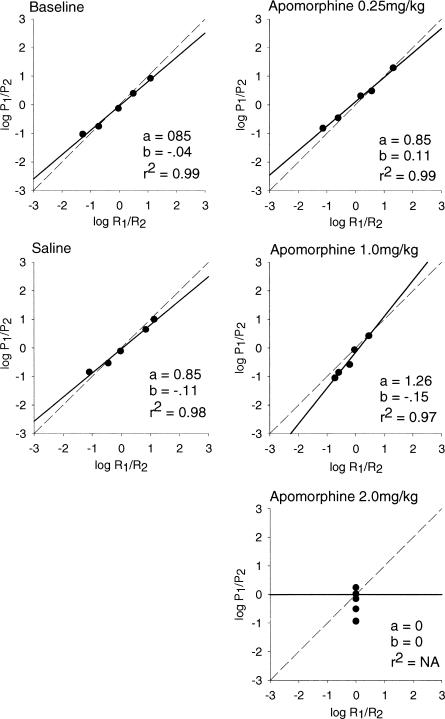
Figure 8. Mean estimates of sensitivity to reinforcement (matching), bias, and goodness of fit for apomorphine rats.
Estimates of matching and bias are based on mean relative rates of responding. The log of P1/P2 is plotted on the y axis, and the log of R1/R2 is plotted on the x axis. The dashed line represents hypothetical matching, and the solid line represents the best-fitting linear regression to the obtained data.

