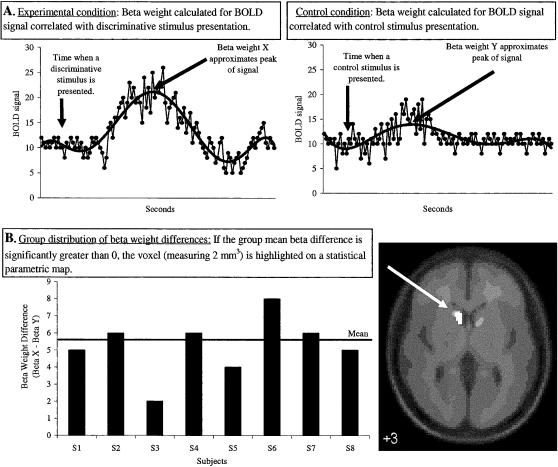
Figure 1. Illustration of the steps used to analyze BOLD fMRI data in SPM2.
(A) shows the relation between a hypothetical BOLD fMRI signal change at a brain voxel for presentations of a discriminative stimulus (left) and a control stimulus (right). For each stimulus type, regression analyses produce different beta weights that approximate signal change. (B) shows beta-weight differences at the voxel for a hypothetical group of subjects when the control stimulus beta is subtracted from the discriminative stimulus beta. If the group difference is significant, the voxel is then highlighted on an anatomical image for display.

