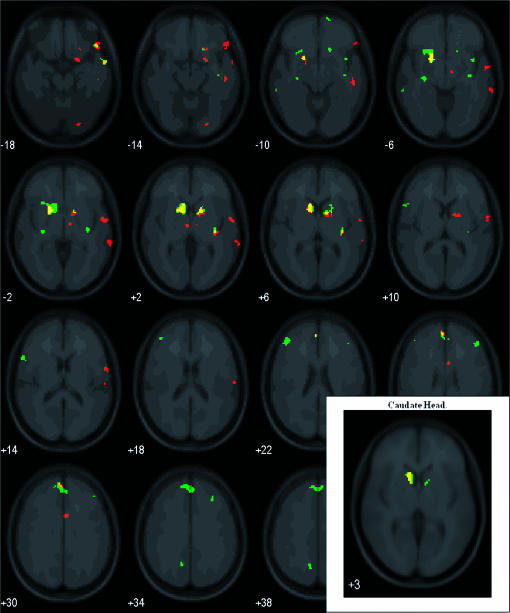
Figure 3. Results of whole-brain group random effect analyses.
Statistical parametric maps highlight voxels with significantly greater activation for the contrasts: press-money > instructed control (red) and no press-next trial > instructed control (green). Yellow voxels represent overlapping regions with activation. The insert highlights activation in the caudate head following small volume corrections. Images are arranged in 4-mm slices (moving left to right) extending upwards (bottom to top of brain) and with the left cerebrum on the left (i.e., left = left).

