
Fig. 1.
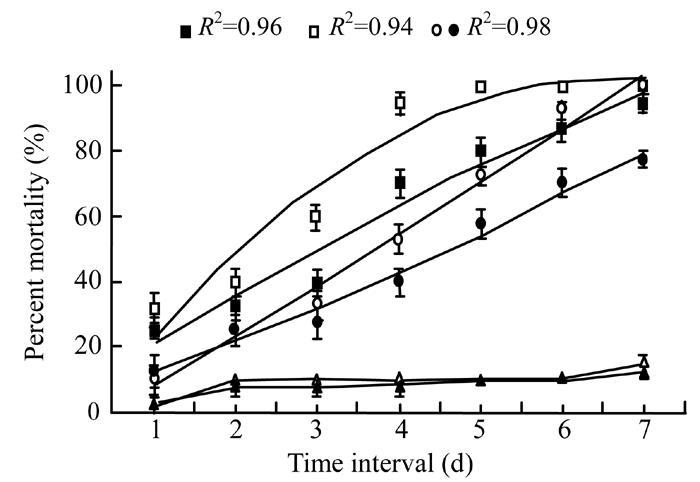
Mortality response of Galleria larvae to Xenorhabdus cells in broth (◦) and water (•), Xenorhabdus secretion in broth (▫) and water (▪), broth alone (∆) and water alone (▲) after different time intervals. The data were fitted on polynomial model (at 6 d.f.) excluding control treatments whereas vertical bars (where larger than the points) represent the standard error (s.e.) of variability of replicates