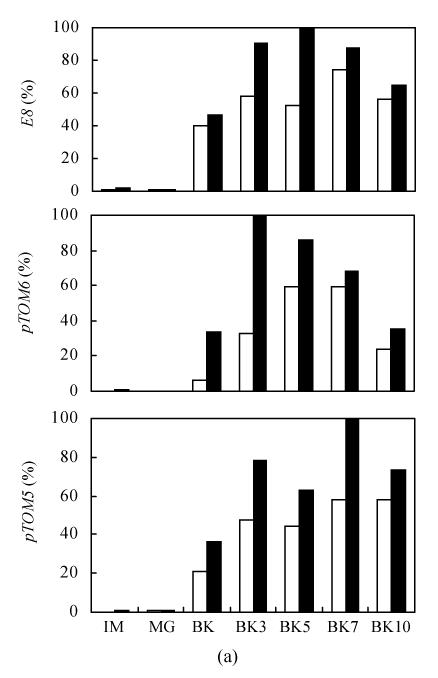
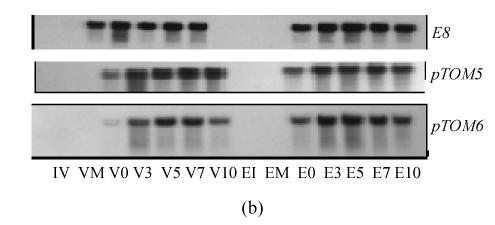
Fig. 4.
The expression of E8, pTOM5 and pTOM6 genes during VFN8 (white) and epi (black) fruit development and ripening (a) Relative percentage of expression (%); (b) Picture of hybridized bands exposure to X-film (V: VFN8; E: epi; I: Immature; M: Mature green; Number after V or E means days after BK stage)


