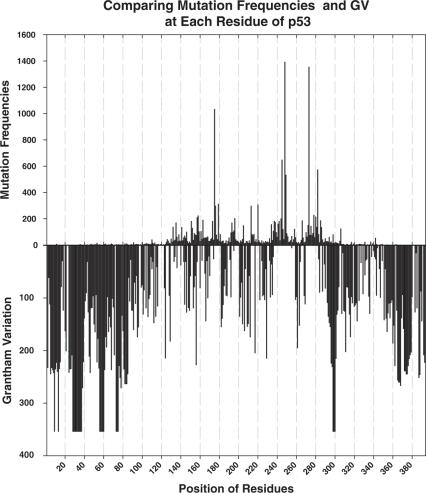
Figure 2.
Comparison between GV and mutation frequency, extracted from the IARC TP53 database, for a given position. Generally, areas comprising residues with low GV values (<61.3, high conservation) correspond to areas with frequently mutated residues (171–181, 237–258 and 270–282). Exceptions of this trend include residues 117–122 and 125–127, which describe areas with low GV values (high conservation) but very low mutation frequency.

