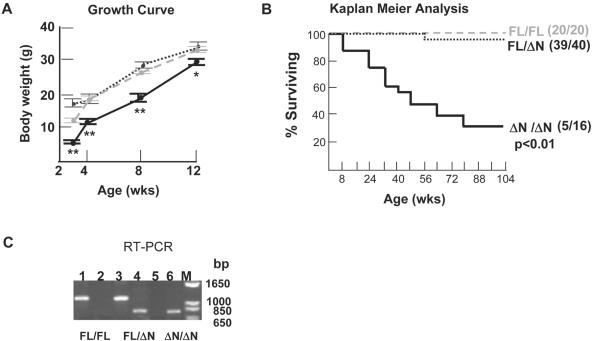
Figure 5.
Growth delay and decreased survival in ΔNter mice. (A) Growth curve for male ZBP-89FL/FL (gray dashed line, n = 20), ZBP-89FL/ΔN (black dotted line, n = 36), and ZBP-89ΔN/ΔN (black solid line, n = 16) offspring. A similar pattern was seen with female mice (not shown). ** P < 0.01; * P < 0.05. A trend toward lower body weights in ZBP-89ΔN/ΔN persisted after 12 weeks, but was no longer statistically significant (data not shown). (B) Kaplan–Meier analysis of survival interval to the onset of morbidity or death. (C) Semi-quantitative RT–PCR analysis of ZBP-89FL and ZBP-89ΔN mRNA levels in the colon.

