Figure 3.
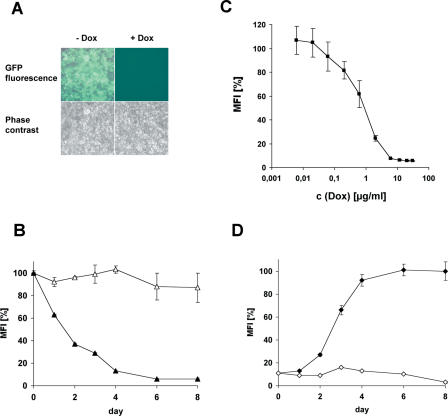
Characterization of Dox-regulated RNAi in a representative cell-clone (C9): (A) Microscopic analysis of cells incubated in the presence or in the absence of 6 µg/ml Dox at 72 h after induction. (B) Time course of Dox-induced RNAi: RNAi was induced or not induced at day 0 by administration of 6 µg/ml Dox and mean intensities of GFP fluorescence were measured by FACS analysis at various times after induction. Closed triangles represent intensities of cells incubated with Dox, open triangles give those of untreated cells. The fluorescence intensity observed at day 0 was defined as 100%, values are means ± SE, n = 3. (C) Mean intensities (± SE, n = 3) of GFP fluorescence obtained by FACS analysis of cells cultivated for 5 days in the presence of various concentrations of Dox. The fluorescence intensity in untreated cells was defined as 100%. (D) Reappearance of GFP fluorescence after withdrawal of Dox: prior to the analysis, cells were cultivated for 5 days in the presence of 6 µg/ml Dox. At day 0, Dox was withdrawn or not withdrawn and the mean fluorescence intensity was followed by FACS analysis. Closed rhomboids represent values from cells that were not treated with Dox from day 0, open rhomboids give values from cells incubated with 6 µg/ml Dox throughout the experiment. The fluorescence intensity measured 8 days after removal of Dox was defined as 100%, values are means ± SE, n = 3.

