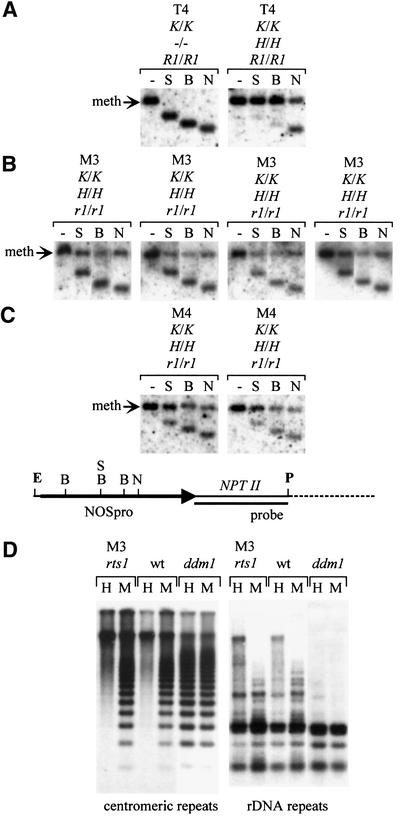
Fig. 5. DNA methylation analysis. As shown in the map below panel C, methylation in the target NOSpro was examined by performing an EcoRI/PstI (E/P) double digest and adding as indicated a methylation-sensitive restriction enzyme: SacII (S) (mCmCGCGG), BstUI (B) (mCGmCG) or NheI (N) (top strand: GCTAGmCaa; bottom: GCT AGmCtg). (A superscript ‘m’ indicates a methylated C that can inhibit cleavage.) The probe consisted of NPTII-coding sequences. (A) Left: the target NOSpro at the K locus is normally unmethylated in the absence of the silencing H locus, as indicated by shifts to the smaller fragments when S, B or N are used. Right: when the silencing H locus is introduced, heavy methylation at the S and B sites and ∼50% methylation at the N site is observed. In individual rts1 plants of the M3 (B) and M4 (C) generations, methylation at the S and B sites is reduced on average to ∼50%. This is similar to the level of methylation at N sites, which remains unchanged in rts1 mutants compared with the wild-type. (D) CG methylation at centromeric and rDNA repeats was examined in rts1 and ddm1 mutants and wild-type (wt) plants using the isoschizomers HpaII (H) (mCmCGG) and MspI (M) (mCCGG). The patterns with H and M appear identical only in the ddm1 mutants, indicating loss of CG methylation. Genotypes of individual plants are indicated above each panel. R1 and r1 are shortened versions of RTS1 and rts1, respectively.

An official website of the United States government
Here's how you know
Official websites use .gov
A
.gov website belongs to an official
government organization in the United States.
Secure .gov websites use HTTPS
A lock (
) or https:// means you've safely
connected to the .gov website. Share sensitive
information only on official, secure websites.
