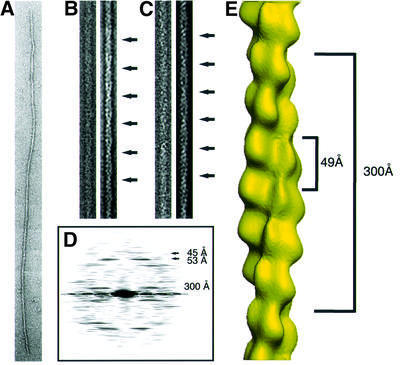
Fig. 2. Analysis of electron micrographs of ParM. (A) A typical ParM filament before straightening. (B and C) The right panel shows the filtered image of the straightened filament in the left panel. The arrows indicate the crossovers of the two protofilaments. (D) Averaged diffraction pattern from six straightened filaments. The layer lines at 45 and 53 Å are derived from one-start left- and right-handed helices. The two-start helix produces the layer line of 300 Å. (E) Three-dimensional reconstruction. The distance of 49 Å between the subunits is the average between the layer lines from the one-start helices. The crossover distance of 300 Å is shown on the right.

An official website of the United States government
Here's how you know
Official websites use .gov
A
.gov website belongs to an official
government organization in the United States.
Secure .gov websites use HTTPS
A lock (
) or https:// means you've safely
connected to the .gov website. Share sensitive
information only on official, secure websites.
