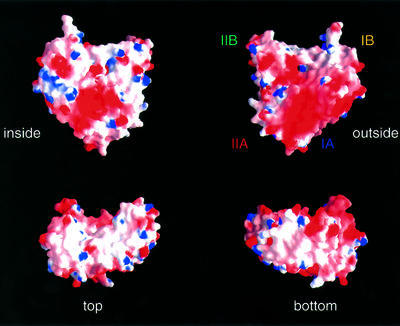
Fig. 5. Surface charge distribution of ParM. The electrostatic potential [–6 kT (red) to +6 kT (blue)] is plotted onto the surface of ParM. The plots shown are a view from the outside of the filaments (‘outside’), and a view facing the second protofilament (‘inside’); ‘top’ and ‘bottom’ show the surface of the subunits after a 90° rotation around the x-axis, with respect to the plots in the upper half of the figure. Subdomains are labelled as in Figure 3. The figure was prepared using GRASP (Nicholls et al., 1991).

An official website of the United States government
Here's how you know
Official websites use .gov
A
.gov website belongs to an official
government organization in the United States.
Secure .gov websites use HTTPS
A lock (
) or https:// means you've safely
connected to the .gov website. Share sensitive
information only on official, secure websites.
