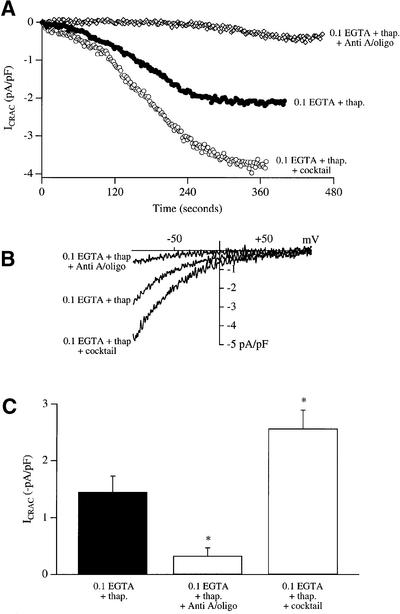
Fig. 3. Mitochondrial Ca2+ buffering regulates the extent of ICRAC evoked by thapsigargin in weak Ca2+ buffer. (A) Time courses of development of ICRAC following dialysis with thapsigargin alone (filled circles), thapsigargin plus cocktail (open circles) and thapsigargin alone after exposure to antimycin A and oligomycin (open diamonds) are shown. (B) Current–voltage relationships for the cells shown in (A) are depicted, taken when the whole-cell currents had reached steady state. (C) Bar chart plotting mean data for the three conditions. *p < 0.01.

An official website of the United States government
Here's how you know
Official websites use .gov
A
.gov website belongs to an official
government organization in the United States.
Secure .gov websites use HTTPS
A lock (
) or https:// means you've safely
connected to the .gov website. Share sensitive
information only on official, secure websites.
