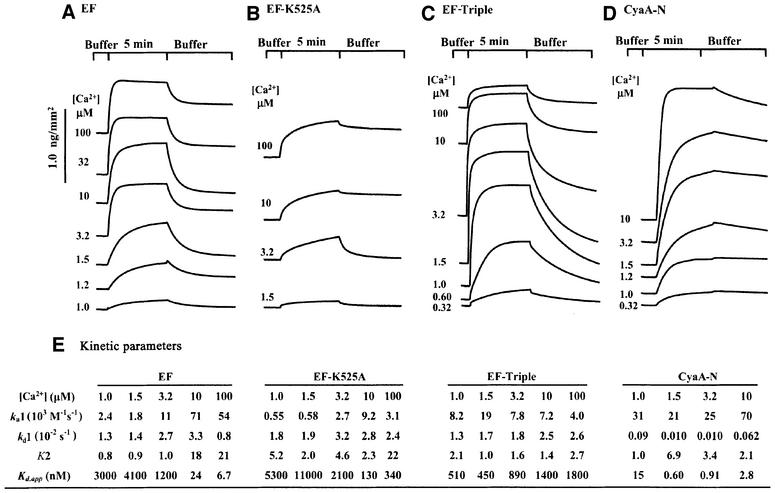
Fig. 3. The effect of calcium ions on the interaction of EF and CyaA-N with immobilized CaM by SPR sensorgram analysis. Sensorgrams were recorded in the presence of 1.4 µM wild-type EF (A), 1.3 µM EF-K525A (B), 0.37 µM CyaA-N (D) and 8.0 µM EF-triple mutant (C) at the indicated free calcium concentrations. (E) Kinetic analysis of SPR sensorgrams based on a ‘two-state conformational change’ model.
At the lowest calcium concentration, signal from the bound EF could be reduced to the base line with the wash using the same calcium concentration. However, a fraction of the signal could not be reduced at the higher calcium concentrations until the buffer with the lowest calcium concentration was used in the wash step. The signal from the bound CyaA-N could not be reduced to the base line without a prolonged wash.


