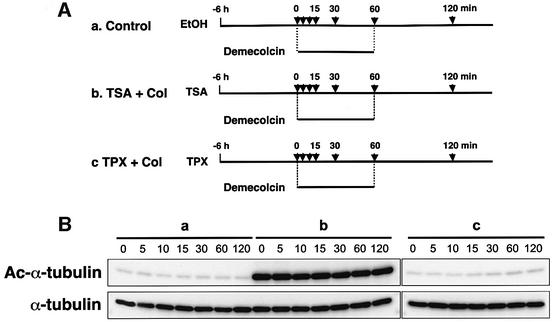
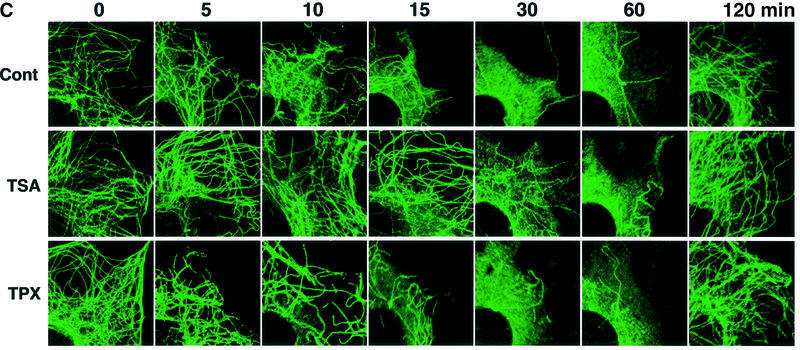
Fig. 5. Delayed depolymerization of microtubules in TSA-treated cells. (A) Schematic representation of experimental procedures. Bars indicate the periods during which the cells were treated with drugs. Arrows indicate the time-points at which cells were taken for immunoblot analysis (B) and immunofluorescent microscopy (C). (B) Cellular levels of tubulin acetylation in the time-course experiments. The amounts of acetylated and total tubulin in the cells treated with various drugs in the time-course experiments designed in (A) were determined by immunoblotting with anti-acetylated α-tubulin (upper) and anti-α-tubulin (lower) antibodies. (C) Depolymerization and repolymerization during demecolcin treatment and removal. Microtubules were visualized by immunofluorescent staining with the anti-α-tubulin antibody. The microscopic images were taken at the time-points indicated in (A).

An official website of the United States government
Here's how you know
Official websites use .gov
A
.gov website belongs to an official
government organization in the United States.
Secure .gov websites use HTTPS
A lock (
) or https:// means you've safely
connected to the .gov website. Share sensitive
information only on official, secure websites.

