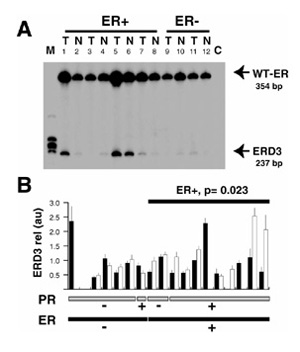
Figure 2.

Comparison of the relative expression of exon 3 deleted estrogen receptor (ER) variant (ERD3) messenger RNA between breast tumor and adjacent matched normal breast samples. (A) Total RNA extracted from frozen tissue sections from tumor (T) and adjacent normal (N) breast tissue samples was reverse transcribed and polymerase chain reaction (PCR) was amplified using D3U and D3L primers. Radioactive PCR products were separated on a 6% acrylamide gel and visualized by autoradiography. Bands migrating at 354 and 237 base pairs were identified as corresponding to wild-type (WT)-ER and ERD3 variant messenger RNA, respectively. C, negative control (no complementary DNA added during the PCR reaction). (B) For each case, signals corresponding to ERD3 variant messenger RNA were quantified and expressed in arbitrary units for tumor (black column) and normal (white column) components. For each sample, the mean and the standard deviation of at least three different polymerase chain reaction (PCR) assays are indicated. Cases are sorted by ER status (black bottom lane) and progesterone receptor (PR) status (gray bottom lane). Samples that failed to have three measurable signals in the four experiments performed in both normal and neoplastic components were not included in the statistical analysis. The significance of the differences between tumor and normal matched components within each subgroup, as tested using the Wilcoxon matched-pair test, is indicated where P <0.05. M, molecular weight marker.
