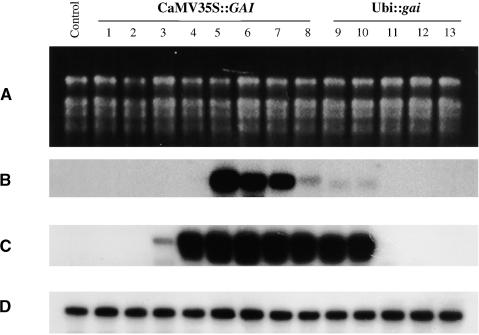
Figure 2.
RNA Gel Blot and RT-PCR Analyses of the Expression of GAI or gai Transcripts in Transgenic Rice.
(A) UV fluorescence of ethidium bromide–stained gel containing RNA from plants (nontransgenic control and 1, G36-1; 2, G36-2; 3, G38-4; 4, G38-17; 5, G39-3; 6, G39-8; 7, G41-22; 8, G41-26; 9, g51-1; 10, g51-6; 11, g58-1; 12, g58-2; and 13, g59-1) used for the hybridization shown in (B).
(B) RNA gel blot analysis of RNA shown in (A) using a radiolabeled GAI ORF as probe.
(C) RT-PCR analysis of GAI/gai transcript levels in RNA from R1 plants. RT-PCR amplification was for 25 cycles using the gai-1 and gai-2 primers (see Methods and Figure 1A).
(D) RT-PCR control showing that actin transcripts are detected consistently in all of the samples used for the GAI/gai RT-PCR experiment shown in (C).

