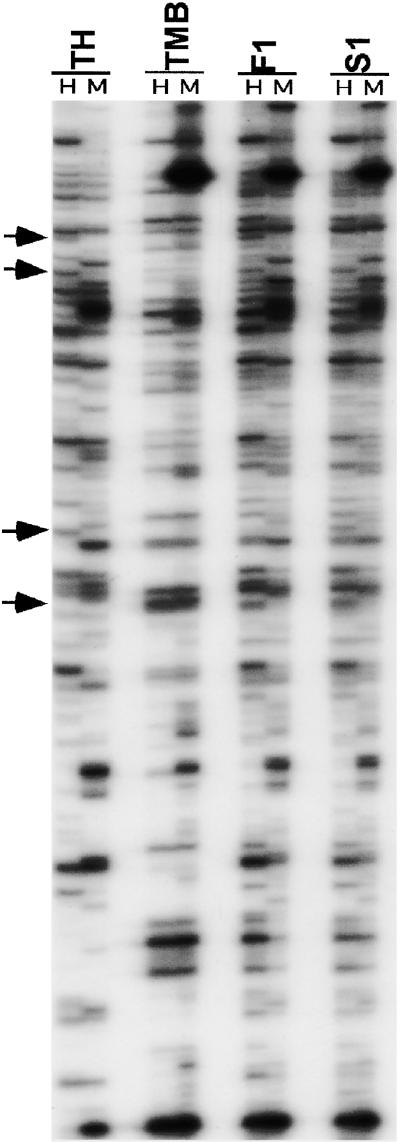
Figure 3.
MSAP Patterns Detected in the Two Diploid Parents, the F1 Hybrid, and the Allotetraploid.
The primer combination used was HM+TCAA/E+ACG. Lines 1 to 4 are Ae. sharonensis (TH), T. monococcum ssp aegilopoides (TMB), the F1 hybrid (F1), and the allotetraploid (S1), respectively. H and M refer to digestion with EcoRI+HpaII and EcoRI+MspI, respectively. Bands that showed alteration in methylation pattern in the F1 hybrid and/or the allotetraploid are shown by arrows.

