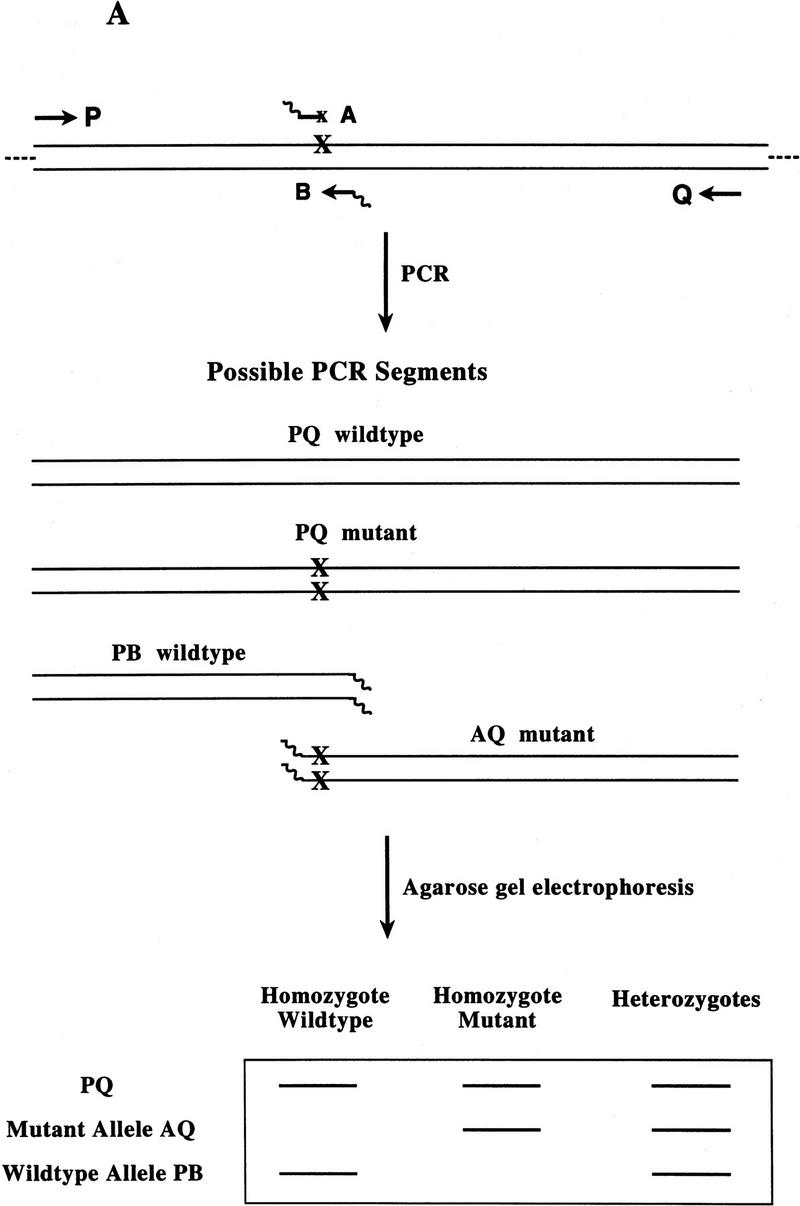
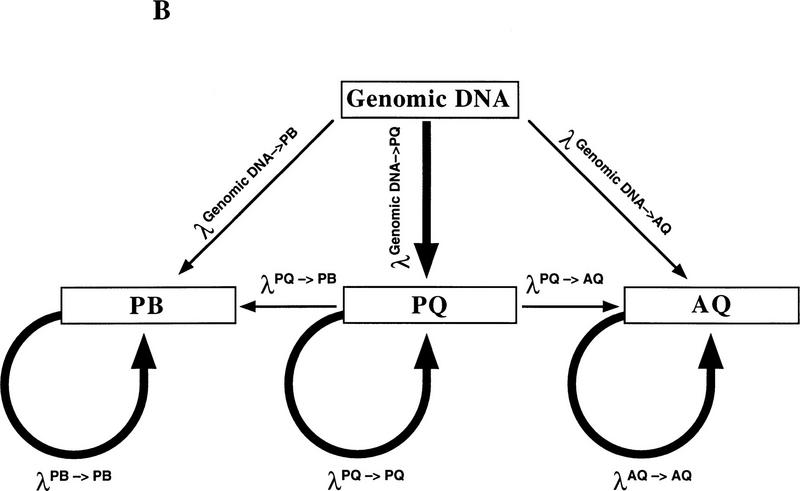
Figure 1.


(A) Schematic of Bi-PASA. The four primers (P, Q, A, and B) are represented by arrows. X represents the sequence change relative to the other allele. Wavy lines on the inner primers represent the noncomplementary 5′ tail sequences. (B) Network structure of Bi-PASA. The four boxes represent the template used in the reaction. Arrows indicate the segments that can be produced from each template. The thickness of the arrows approximates the efficiency of amplification. The Bi-PASA reaction can be divided into two parts: template transfer amplification (genomic DNA → PQ, PB, and AQ; PQ → PB and AQ) and self-amplification (PQ → PQ, PB → PB, and AQ → AQ). The amplification efficiency, λ, for a particular segment from a given template is defined as the molecular ratio from cycle n to cycle n + 1. [PQ]n + 1, [PB]n + 1 and [AQ]n + 1 are the PCR product yields of PQ, PB, and AQ, respectively, at the end of the n + 1 cycle. [Genomic DNA] represents the yield of genomic DNA. The accumulation of PQ, PB, and AQ DNA products can be indicated as follows: [PQ]n + 1 = [PQ]n × (1 + λnPQ → PQ) + [genomic DNA] × λngenomic DNA → PQ; [PB]n + 1 = [PB]n × (1 + λnPB → PB) + ½ × [genomic DNA] × λngenomic DNA → PB + ½ × [PQ] × λnPQ → PB; and [AQ]n + 1 = [AQ]n × (1 + λnAQ → AQ) + ½ × [genomic DNA] × λngenomic DNA → AQ + ½ × [PQ] × λnPQ → AQ.
