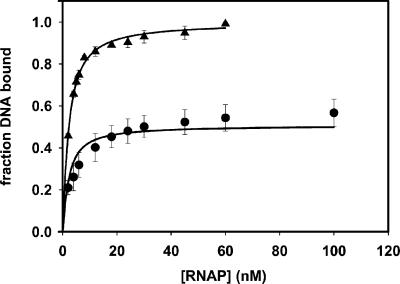
Fig 2.
Determination of equilibrium affinities by titration of wt Fork with RNAP. The reactions contained 1 nM wt Fork and variable amounts of RNAP as shown and were analyzed by electrophoretic mobility shift immediately (▴; data shown are averages of three independent experiments) or after a challenge with 100 μg/ml heparin for 10 min (•; data shown are averages of four independent experiments). The curves shown reflect the simultaneous error-weighted fits of the data to Eqs. 3 and 4–7. The parameters are shown in Table 1 (line 1).

