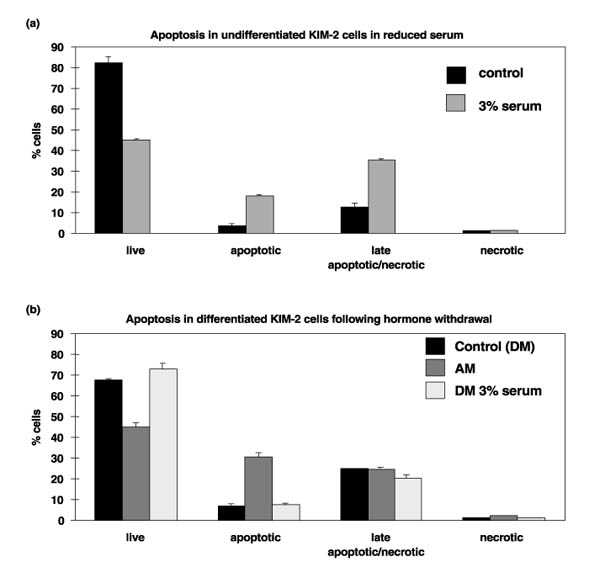
Figure 12.

Analysis of apoptosis by flow cytometry. (a) Cells were induced to undergo apoptosis by culturing in reduced serum (3%) and the absence of additional growth factors for 24 h. (b) Cells that had been cultured in differentiation medium (DM) for 12 days were induced to undergo apoptosis by removal of prolactin, insulin and dexamethasone (AM) for 17 h. Control and dying cells were stained with annexin V and propidium iodide (PI) and analyzed by flow cytometry. PI enters only cells with damaged membranes (late apoptosis or necrosis). Four populations of cells were identified: live (no stain), apoptotic (annexin V only), late apoptotic/necrotic (annexin V +PI) and necrotic (PI) only. The percentage of cells in each population is shown as the mean of three experiments with the standard error of the mean.
