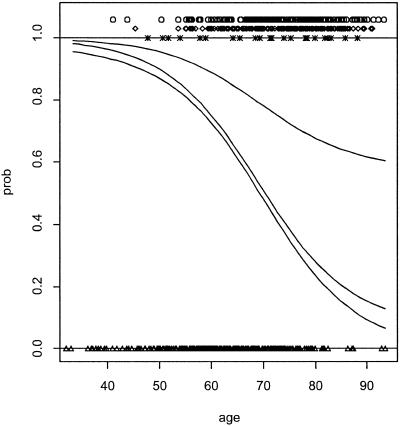
Fig 4.
Ten-year risk of mortality by cause as a function of age and two other risk factors, glycosylated hemoglobin and systolic blood pressure at baseline. The other risk factors have been set at their medians for the plot. The differences between adjacent curves (from bottom to top) are probabilities for alive, diabetes, heart attack, and other causes, respectively. The data are plotted as triangles (alive, on the bottom), crosses (diabetes), diamonds (heart attack), and circles (other). (Reproduced from ref. 25 with permission.)

